Library · The Fiddler: Solutions · Chapter 3
Can You Swap the Cups?
Three cups labelled A, B and C stand in a row. A friend picks two of the three positions at random and swaps the cups there. She keeps doing this, choosing a fresh random pair each time, until the cups are back in the order A, B, C.
On average, how many swaps does that take?
The Fiddler, Zach Wissner-Gross, September 18, 2026(original post)
The official solution appeared in the post of September 25, 2026 and gives for the main puzzle, by the same route: the six orders form a bipartite graph, so each swap lands uniformly on the other side. It also notes the general fact that a vertex-transitive connected graph on vertices has expected return time . The Extra Credit half of that post is paywalled, so is my own and has not been checked against it.
Solution
There are six orders of three cups, and each swap moves the cups from one order to another. The question worth asking first is which orders a single swap can reach.
Call an order even or odd according to how many pairs of cups stand the wrong way round. Every swap flips it. Three orders are even: ABC itself and its two rotations, BCA and CAB. The other three, ACB, BAC and CBA, are odd, since each is a single swap away from ABC.
Now fix any order and try the three possible swaps. They produce three different orders, all of the opposite parity, and there are only three of those. So from every order the three swaps lead to the three orders of the other parity, one each. In the language of graphs the swaps form : every even order is joined to every odd one.
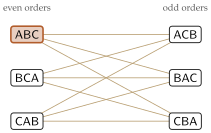
That is the whole puzzle. After every swap the cups stand in a uniformly random order of the new parity, whatever happened before, so each swap is a fresh draw that remembers nothing.
Look only at the even-numbered swaps, the second, fourth, sixth and so on. Before each of them the cups are in an odd order, and after it they are in one of the three even orders, chosen uniformly and independently of everything earlier. So each even-numbered swap restores ABC with probability , while the odd-numbered swaps never can. The number of even-numbered swaps needed is geometric with success probability , which averages , and each costs two swaps:
A second route reaches the same number without any of this structure. In the long run every one of the six orders is equally likely, and for a random walk of this kind the average time to return to a state is the reciprocal of the long-run share of time spent there. One order in six gives a return time of six. The two arguments agree, and the first says why.
The computation
The check swaps cups, with nothing from the argument built in.
def swap(p, t):
    q = list(p); q[t[0]], q[t[1]] = q[t[1]], q[t[0]]; return tuple(q)

T = [(0, 1), (0, 2), (1, 2)]
start = (0, 1, 2)
for _ in range(R):
    p, k = swap(start, T[rng.integers(3)]), 1
    while p != start:
        p = swap(p, T[rng.integers(3)]); k += 1
    back.append(k)
Four hundred thousand trials give , and every return time recorded is even, as the parity argument requires. Solving the Markov chain on the six orders in exact fractions gives exactly.
Extra Credit
Counting the starting order, there are six possible orders of the cups. On average, how many swaps does it take until all six have appeared?
Solution
The structure found above does more work here than it did in the main puzzle. The odd-numbered swaps draw an odd order uniformly at random, independently each time, and the even-numbered swaps do the same for the even orders. The walk is two separate lotteries run in alternation, and the task is to see every prize in both.
On the odd side all three orders are new. Collecting three equally likely coupons takes draws on average. Writing for the number of draws, and noting that the th odd draw is swap , the odd side is complete at swap , so On the even side ABC has already been seen, and a draw of it is wasted, so only two prizes are wanted out of three. The first arrives after draws on average and the second after more. With even draws and the th of them at swap , the even side is complete at , and
All six orders have appeared once both sides are complete, at swap . The two sides run simultaneously, so the answer is well short of , and the identity isolates exactly what the overlap saves. The lotteries use separate draws, so and are independent and Both tails are small inclusion-exclusion counts. After odd draws at least one odd order is still missing with probability and after even draws at least one of the two wanted even orders is missing with probability After swaps each side has had draws, and after the odd side has had one more. Multiplying the tails produces geometric series in , and . The even values of contribute and the odd values , so and The in the denominator comes from the cross term, where leaves .
For comparison, if the friend shuffled the cups into a uniformly random order each time instead of swapping, seeing the five new orders would take shuffles on average. Swapping wins by about one and a half steps, because a swap can never leave the cups where they were, nor land on the parity it has just visited, so it wastes fewer draws than a full shuffle does.
The computation
Three independent checks. The first solves the Markov chain whose state is the set of orders seen so far together with the current order, in exact fractions, knowing nothing of parity or ; it returns . The second sums the two-lottery tail series directly and returns The third swaps cups until all six orders have appeared.
for _ in range(R):
    p, seen, k = start, {start}, 0
    while len(seen) < 6:
        p = swap(p, T[rng.integers(3)]); k += 1; seen.add(p)
    cover.append(k)
Four hundred thousand trials give , within a standard error of .