Library · The Fiddler: Solutions · Chapter 1
Can You Swim With the Fishes?
Two koi share a long straight pond. Nemo swims at one mile per hour and Dory at two, and both spend the day going back and forth. A sensor placed in the water records the speed of every fish that passes it. After several days of logging, what average should you expect from the recorded speeds?
The Fiddler, Zach Wissner-Gross, October 2, 2026(original post)
The official solution appears in the post of October 9, 2026, which had not been published when this chapter was written. The answers here are my own.
Solution
The tempting answer is the average of the two speeds, miles per hour. It is wrong, and the reason is worth more than the arithmetic that replaces it.
The log does not hold one entry per fish. It holds one entry per passing, and the two fish do not pass at the same rate. A fish of speed in a pond of length takes time to cross from one end to the other, and it goes by the sensor once on each such trip, so its entries arrive at a rate of per hour. That rate is proportional to the speed. Dory, swimming twice as fast, appears in the log twice as often.
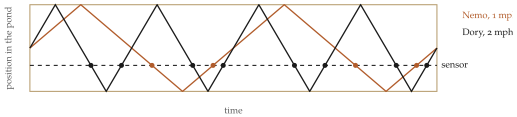
In a long log, then, two entries in every three belong to Dory and one to Nemo, and the average of the recorded speeds weights each speed by itself:
Neither the sensor nor the fish is behaving oddly. The sampling is simply not uniform over fish, because a fish that moves more gets measured more. The same effect makes a bus stop feel slower than the timetable promises, and makes asking people how large their class is give an answer that is too large. Every observation here is made by something the observed object had to arrive at, and arriving is what the fast do more often.
The computation
The check counts crossings rather than assuming the rate law the argument rests on. A bouncing path is unfolded into a straight one, so a fish starting at with speed is at the sensor whenever is congruent to modulo twice the pond’s length. The unfolding is itself checked against a brute-force count of the sign changes of the folded path, which is the step most likely to hide an off-by-one.
def crossings_unfold(v, T):
    """times t in [0,T] with the unfolded path x0 + |v| t equal to +-P mod 2L"""
    s, hi, n = abs(v), X0 + abs(v)*T, 0
    for target in (P, -P):
        k_lo = np.ceil((X0 - target)/(2*L))
        k_hi = np.floor((hi - target)/(2*L))
        n += max(0, int(k_hi - k_lo) + 1)
    return n
The two counts agree exactly at every speed tried. Over a long run the fish of speed and produce and entries, a ratio of exactly , and the logged average comes to .
Extra Credit
Now the pond holds many koi, all starting at the centre, with velocities drawn from a normal distribution of mean and standard deviation mile per hour. The sensor records the speed of every fish that passes it, direction ignored. What value does the average recorded speed approach?
Solution
The counting argument never cared how many fish there were or how their speeds were spread, so it carries over whole. A fish of speed passes the sensor at a rate proportional to , so in a long log the chance that a given entry belongs to a fish of speed near is proportional to times how common that speed is among the fish. Writing for the density of the fish’s speeds, the log has density the denominator being whatever makes it integrate to one. Averaging against gives the single formula that runs both halves of this puzzle: With speeds and equally common it returns , which is the main puzzle again.
Here the velocity is standard normal and the speed is . Both moments are standard: , and , the mean of a half-normal. So
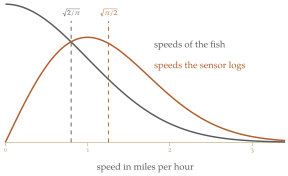
Two things follow worth keeping. The answer is exactly times the average speed of the fish themselves, , so weighting by speed inflates the figure by about per cent, and that factor depends on the shape of the distribution rather than its scale.
The second is the shape of the log itself. Multiplying the half-normal density by and normalising gives which is the Rayleigh distribution. The sensor’s log is therefore distributed exactly as the speed of a particle whose velocity is normal in two dimensions rather than one, and the mean of that distribution is .
The computation
Counting crossings for two hundred thousand fish gives a logged average of , against computed from the same sample. That agreement is the part that matters, since it confirms the weighting without appealing to the normal distribution at all.
The gap from there to is sampling error in the speeds themselves, and it closes with more fish. Twenty million give against , and the ratio of the logged mean to the true mean comes to against .