Books · Jane Street: Solutions
Chapter 4
Well Well Well
A -by- well is dug. It has a peculiar shape: its depth varies from one -by- section to another, as shown below. Each section is marked with its depth. (E.g., the deepest section is deep.)
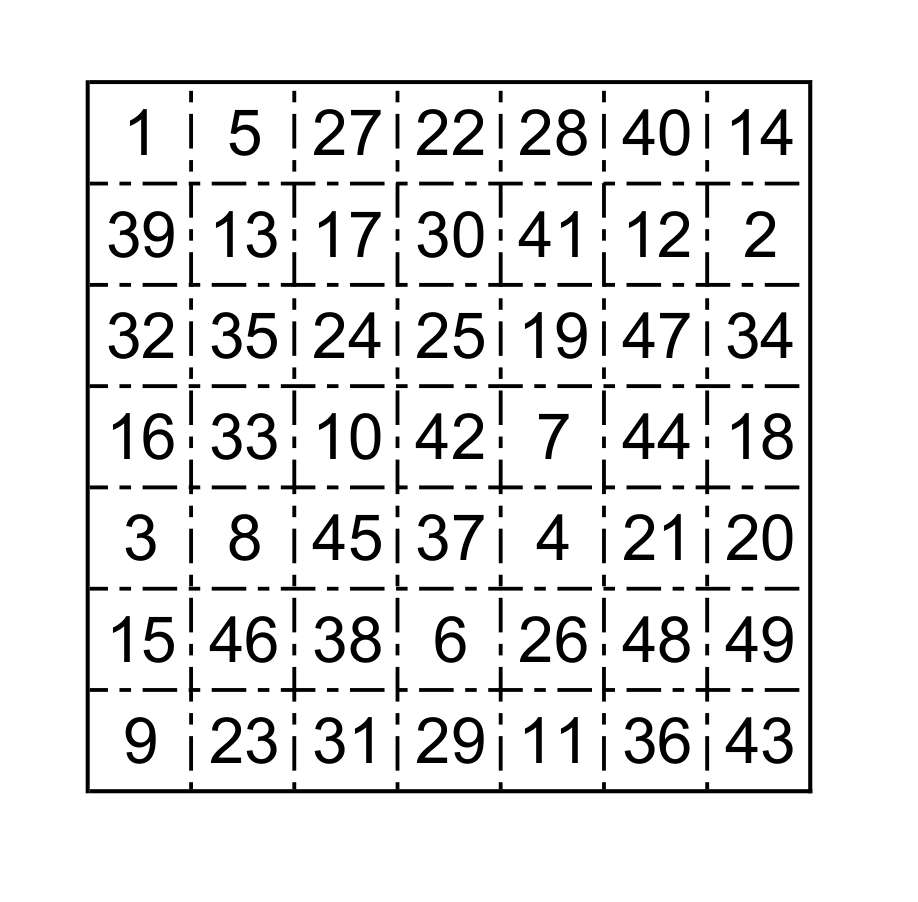
Water is poured into the well from a point above the section marked , at a rate of cubic foot per minute. Assume that water entering a region of constant depth immediately disperses to any orthogonally adjacent lower-depth regions evenly along its exposed perimeter.
After how many minutes will the water level on section begin to rise?
Solution
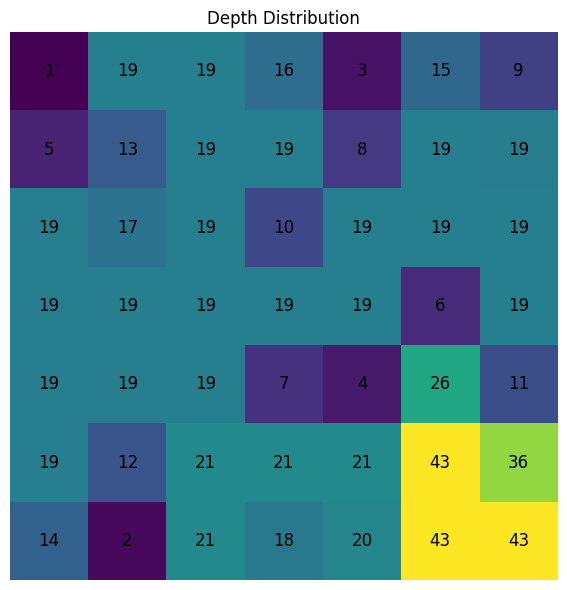
The grid below shows the depths of the well after minutes. In the next minute the water in the last well will rise.
Python code
import networkx as nx
from fractions import Fraction
from matplotlib import pyplot as plt
import numpy as np

def find_next_deeper_neighbors(G, start):
    depth = G.nodes[start]['depth']
    equal_depth_nodes = {start}
    frontier = [start]
    while frontier:
        node = frontier.pop(0)
        for neighbor in G.neighbors(node):
            if (G.nodes[neighbor]['depth'] == depth
                    and neighbor not in equal_depth_nodes):
                equal_depth_nodes.add(neighbor)
                frontier.append(neighbor)
    deeper_neighbors = set()
    for node in equal_depth_nodes:
        for neighbor in G.neighbors(node):
            if G.nodes[neighbor]['depth'] > depth:
                deeper_neighbors.add(neighbor)
    return list(equal_depth_nodes), list(deeper_neighbors)

def distribute_water(G, node, water_amount):
    deeper = [n for n in G.neighbors(node)
              if G.nodes[n]['depth'] > G.nodes[node]['depth']]
    if deeper:
        share = Fraction(water_amount, len(deeper))
        for n in deeper:
            distribute_water(G, n, share)
    else:
        equal_nodes, next_deeper = find_next_deeper_neighbors(G, node)
        if next_deeper:
            share = Fraction(water_amount, len(next_deeper))
            for n in next_deeper:
                distribute_water(G, n, share)
        else:
            if equal_nodes:
                share = Fraction(water_amount, len(equal_nodes))
                for n in equal_nodes:
                    G.nodes[n]['depth'] -= Fraction(share, 1)
            else:
                G.nodes[node]['depth'] -= Fraction(water_amount, 1)

def plot_depths(G):
    max_x = max(n[0] for n in G.nodes())
    max_y = max(n[1] for n in G.nodes())
    depths = np.zeros((max_y + 1, max_x + 1))
    for node, data in G.nodes(data=True):
        depths[node[1], node[0]] = data['depth']
    fig, ax = plt.subplots(figsize=(6, 6))
    ax.imshow(depths)
    for i in range(depths.shape[0]):
        for j in range(depths.shape[1]):
            ax.text(j, i, int(round(depths[i, j], 0)),
                    ha="center", va="center", color="black", fontsize=12)
    ax.set_title("Depth Distribution")
    plt.axis('off')
    plt.tight_layout()
    plt.show()

def simulate_water_flow(G):
    t = 0
    while G.nodes[(6, 6)]['depth'] == 43:
        distribute_water(G, (0, 0), Fraction(1, 1))
        t += 1
    print("The amount of time required to start filling well (6,6) is", t - 1)

def create_well_depth_lattice():
    depths = [
        [ 1,  5, 27, 22, 28, 40, 14],
        [39, 13, 17, 30, 41, 12,  2],
        [32, 35, 24, 25, 19, 47, 34],
        [16, 33, 10, 42,  7, 44, 18],
        [ 3,  8, 45, 37,  4, 21, 20],
        [15, 46, 38,  6, 26, 48, 49],
        [ 9, 23, 31, 29, 11, 36, 43],
    ]
    G = nx.grid_2d_graph(7, 7)
    for i in range(7):
        for j in range(7):
            G.nodes[(i, j)]['depth'] = Fraction(depths[i][j], 1)
    return G

G = create_well_depth_lattice()
simulate_water_flow(G)
plot_depths(G)